


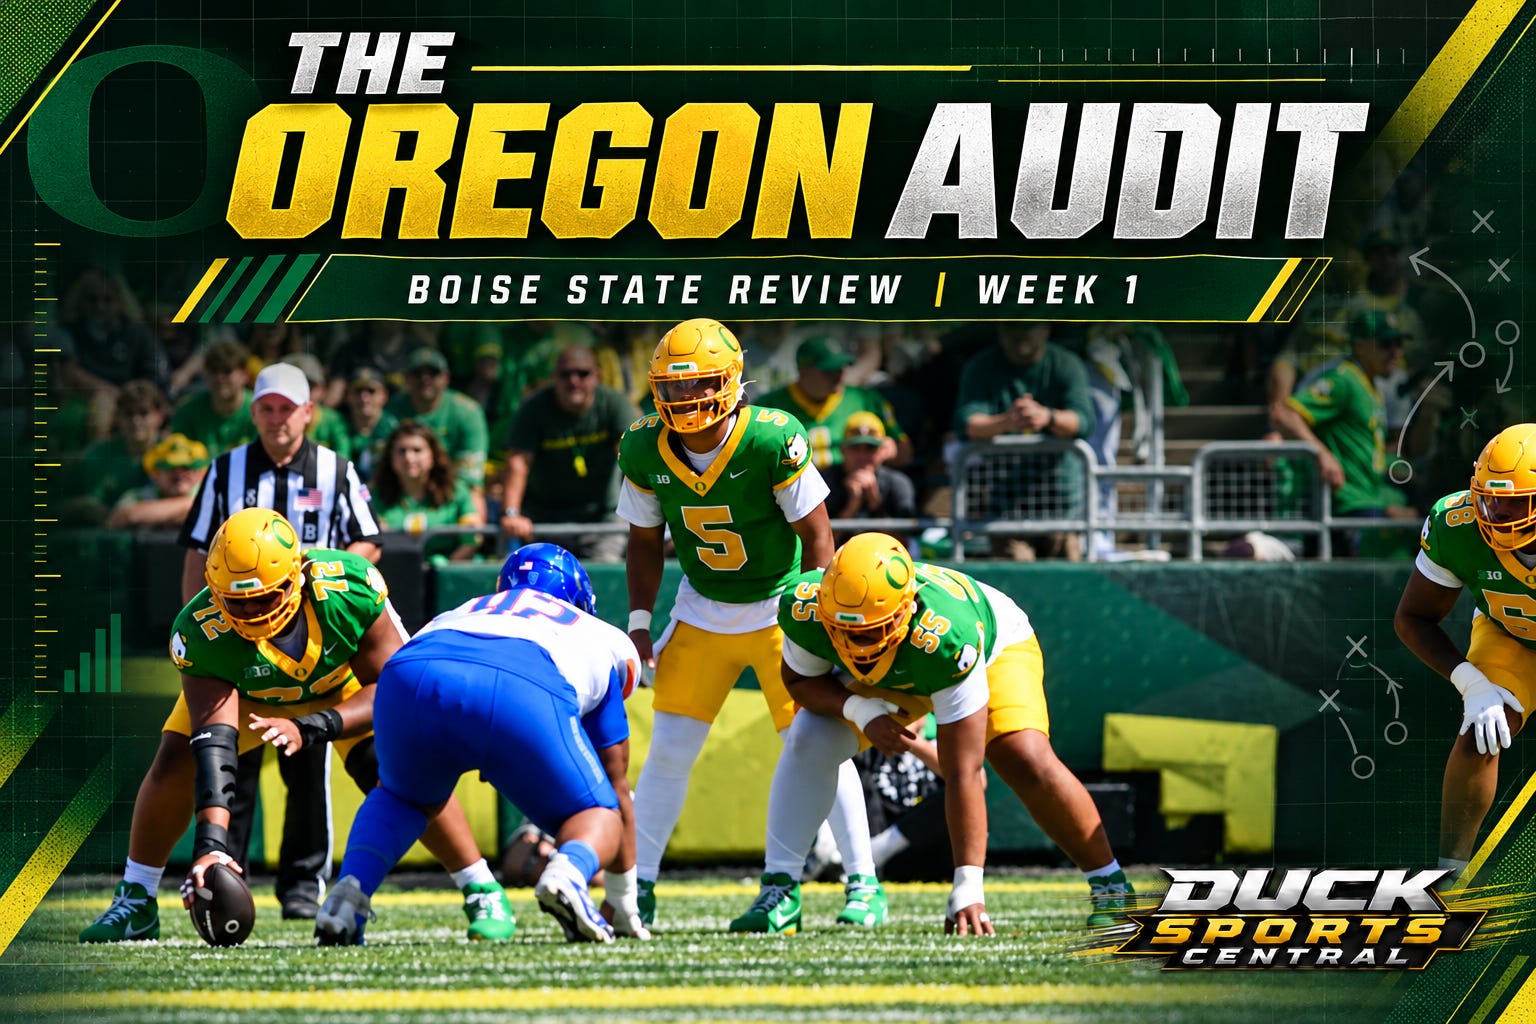
There is a danger in trying to understand a football game while it is still happening. You are reacting to the last play while trying to keep up with the next one, and the scoreboard inevitably begins coloring everything around it. A 4-yard run looks different when a team is trailing by 10. A third-down incompletion carries more weight when it follows another stalled possession. A defensive series that would otherwise look perfectly acceptable can begin to tell a different story when the opponent keeps hanging around.
That was one of the things that stood out Saturday.
There were stretches of Oregon’s 34-27 win over Boise State when the defensive front looked nothing like the group we had heard about throughout fall camp. The offense felt disjointed, particularly early, when a running back room that was supposed to be one of the strengths of the roster barely seemed involved. Oregon clearly had more individual talent, yet that advantage kept appearing in bursts rather than through the kind of sustained control expected from the No. 2 team in the country.
My notes during the game kept returning to those same observations. The havoc was largely missing. The interior defensive line was not consistently controlling the game. The offensive line was having trouble imposing itself. Oregon had more yards, more talent and plenty of individual highlights, yet Boise State kept answering.
A few days later, much of that initial evaluation still holds. What has changed is the explanation for why it happened.
That is really the purpose of The Oregon Audit, a new final stop in our weekly postgame coverage before Wednesday turns the conversation fully toward the next opponent. The idea is not to throw away what we saw and replace it with a spreadsheet. It is to take those first observations from Saturday afternoon and force them to survive another layer of evidence.
Sometimes the numbers will confirm exactly what the game appeared to show. Other times they may tell us we identified the right symptom but blamed the wrong cause. The first Audit gave us a little of both.
Oregon officially outgained Boise State 497-274, averaged 7.9 yards per play to the Broncos’ 4.2 and threw for 378 yards. Yet the teams finished tied with 18 first downs apiece, Oregon converted only 4 of 12 third downs and went 0 for 3 on fourth down, while the Ducks committed 10 penalties for 90 yards.
Those contradictions are where the deeper numbers become useful.
Game on Paper evaluates each snap rather than simply adding up the final yardage, and there are a few terms we will use regularly in this series that are worth explaining before we start assigning grades.
The first is EPA, or expected points added. Every situation in football carries an expected scoring value based on where the ball is, the down and the distance. First-and-10 at your own 20 has one value; first-and-10 at the opponent’s 20 has a much larger one. EPA asks how much a play improved or damaged that position. A 25-yard completion normally creates positive EPA because the offense is much more likely to score afterward. A sack on second down creates negative EPA because the offense has suddenly become much less likely to score.
The second is success rate, which is even easier to understand. Rather than asking how many yards a team accumulated, it asks how often an individual play accomplished enough for the situation. That matters because an offense can gain 60 yards on one snap, fail on its next three and still have an impressive-looking average. Success rate helps distinguish a team that steadily stays ahead of the defense from one that survives through occasional explosions.
That distinction may explain Oregon’s opener better than anything else.
Game on Paper had Oregon at 7.89 yards per play, good enough for the 91st percentile of its comparison data. Put simply, the Ducks generated more yardage per snap than roughly nine out of every 10 comparable FBS performances. Oregon’s 13% explosive-play rate — the frequency with which it created plays that dramatically altered field position and expected scoring value — was even better, landing in the 93rd percentile.
Then comes the contradiction: Oregon’s overall success rate was only 44%, essentially middle of the pack and barely ahead of Boise State’s 42%. Oregon produced 0.18 EPA per play compared with minus-0.04 for Boise State.
The easiest translation is also the foundation for the entire offensive grade: Oregon was exceptionally dangerous Saturday without being exceptionally consistent.
