


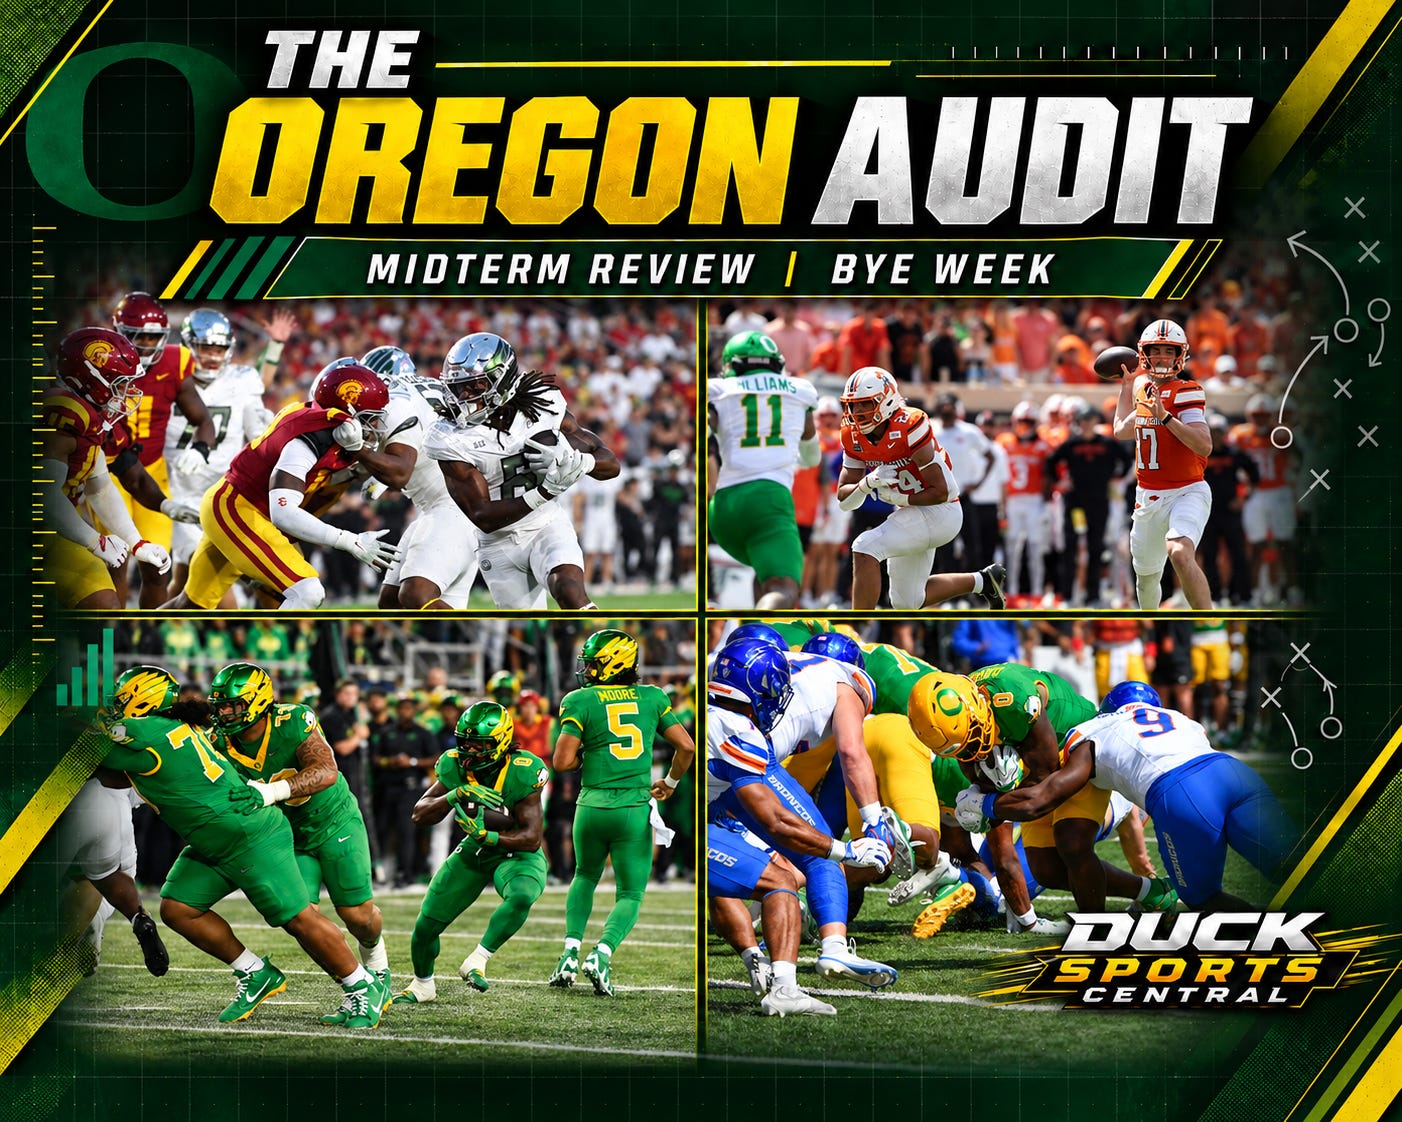
Four games are enough to begin believing the numbers, but they are not enough to stop questioning them. That distinction matters with Oregon sitting at 3-1 after a first month that has produced just about every version of this team we could reasonably have expected to see.
The Ducks were good enough to beat Boise State without playing particularly cleanly, bad enough in Stillwater to lose control of a game they entered expecting to win, overwhelmingly superior to Portland State and then good enough to walk into the Coliseum, lose their starting quarterback and still beat USC 41-27. Those four games make a traditional weekly Oregon Audit less useful this time because, rather than asking what one Saturday told us, the bye gives us a chance to put the entire month under the microscope and ask whether the things we thought we were seeing are now supported by a meaningful amount of evidence.
Dan Lanning has essentially been doing the same thing internally. Oregon devoted the beginning of the bye to a substantial self-scout, looking at the things opponents can recognize repeatedly and asking, in Lanning’s words, “How can we change this? What can look different?” He was also careful to make the other point that matters when we start examining tendencies too aggressively: “Good teams have tendencies.”
The objective is not to become unpredictable simply for the sake of being unpredictable. It is to understand what Oregon does well enough that opponents cannot use the Ducks’ own tendencies against them, which sounds like a pretty good description of what we are trying to do here, too.
A quick reminder about what these numbers are actually measuring
There is one complication before we start handing out grades because not every model is looking at exactly the same Oregon season. The official cumulative numbers include Portland State, which means the 84-0 win and everything that came with it remains inside Oregon’s 47.5 points per game, 7.1 yards per play and other season averages.
Game on Paper and FEI, however, use FBS-versus-FBS data for the measurements we are discussing here, which removes Portland State entirely. FEI then evaluates possession efficiency after adjusting for opponent quality, while SP+ is a predictive, tempo- and opponent-adjusted model. F+ blends FEI and SP+, and FPI brings its own predictive assessment of team strength.
That matters because Portland State was both a real football game and a statistical distortion. Oregon deserves credit for executing at a ridiculous level that night because the Ducks still had to block people, tackle people, protect the ball and finish drives, but an 84-point win over an FCS opponent should not carry the same weight in evaluating Oregon’s national championship ceiling as Boise State, Oklahoma State or USC.
The disagreement between the different models therefore becomes useful rather than inconvenient. Raw season statistics tell us what Oregon has produced, Game on Paper tells us how the Ducks have performed snap by snap against FBS competition, FEI tells us what those possessions look like after opponent adjustment, and SP+, F+ and FPI ask versions of a more predictive question about how good we should expect Oregon to be going forward.
Four games in, those answers are not quite the same.
